Suburb/History: Difference between revisions
From The Urban Dead Wiki
Jump to navigationJump to search
(→December: December 4) |
|||
| Line 105: | Line 105: | ||
<gallery> | <gallery> | ||
Image:080325-suburb-dangermap.png|2008, March 25 | Image:080325-suburb-dangermap.png|2008, March 25 | ||
Image:041208.PNG|2008, December 4 | |||
</gallery> | </gallery> | ||
Revision as of 21:51, 4 December 2008
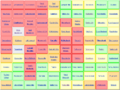
The Dangermap System


- Before
- Before the current dangermap system, the Urban Dead wiki had a 10x10 table with the names of every suburb, danger levels for each suburb shown as different colors for the borders of each cell. This style not only provided poor visual feedback for the users, but also was hard to maintain, since every danger level was hard coded into the table with HTML markup. This could lead to customized danger levels, such as purple or blue, or simply break the entire table.
- While this system was highly inefficient, it was because it existed before the current Dangermap System was created.
- First Version
- The first version of the dangermap system used the same old table to input the danger levels, but now it provided a better visual output for users. It no longer used hard coded HTML markup, but used a system based on templates. It also provided a way for users to timestamp their danger reports inside the table, which was not available in the previous version.
- While providing a better visual output, this table was also hard to maintain, and there was no integration with the suburb pages.
- The Second (and Current) Version
- The second version was created with two things in mind: to make it easy to update the table; and to provide a way to integrate the data from the dangermap with the then recently created {{suburb}} template. This system provided a way to update every cell of the table independently, by updating a user template that was created for each suburb. No longer were edit conflicts an issue when editing the dangermap in the Suburbs page.
- With the data from the dangermap system, it was now possible to feed the dangermap table AND the dangermap of the minimap into every suburb page. Thus a single edit in the wiki provided changes to ~10 different pages.
- When this template was created, there was little knowledge about how the MediaWiki framework works, thus the templates for the danger levels of each suburb were stored as subpages of the DangerReport user. Back then, the regular pages as templates exploit was thought to only work with pages inside the user namespace, and pages that abused this exploit didn't showed up in the used templates list when editing a page; this way when editing the Suburbs page a user wouldn't see the more than 100 templates being used in that page. After the MediaWiki framework was updated, however, this exploit became useless, causing several new users to ask themselves why the system was made this way.
- The Danger Levels
- The original Second Version, and all previous dangermaps, only had four different danger levels: Safe, Moderate, Dangerous and Very Dangerous. The exact guidelines of when a suburb was at each one of these levels always created month-length discussions in the Suburb talk page, and there might still be ongoing discussions on it to change these guidelines. A fifth one was created in 2007, Ghost Town.
- A different set of templates is used for noteworthy suburbs. The only difference in this set is the fact that it bolds the name of the suburb on the dangermap, providing an easy way for players to recognize the most important burbs in Malton.
- Critics
- While being a really helpful tool for the Urban Dead community, the Suburb Dangermap System was always criticized of being impartial, biased, exaggerated, and, in some occasions, outdated. Some of these criticisms might be true, since the system depends on user input based on an incomplete set of guidelines. A burb can easily be Safe for someone and Dangerous for another, the difference being on where and how the players made the survey.
- Some of these criticisms may have been exacerbated by the way the danger map is used by some as a measure of a group's success in an area.
- The system was also prone to Propaganda. Some Survivors groups always tried to make their home burbs appear safe in the dangermap system, while zombies were trying to make them look Very Dangerous. Some users would use the system to provide misinformation, so that others would avoid dangerous burbs, or lure them to safe burbs that were actually being overrun by zombies.
- And, finally, since the system depends on user input, this requires people to live in the suburb and be an active user in the wiki. The southern suburbs often have their danger levels unchanged for long periods of time, since only a few group of survivors actually live in them, while the northern suburbs have their danger levels changed almost daily, due the constant history of sieges and battles that happens there.
The Record
This page was created for the sake of keeping track of the evolution of the danger levels of each suburb in Malton, keeping a record of screenshots taken from the suburbs page.
New monthly headers goes on the bottom.
2008
July
2008, July 9

August

2008, August 16

November
- GiantBoob.jpg
2008, November 2
- 15Nov08.png
2008, November 15
- Suburb-dangermap-20081124.png
2008, November 24
- Dmap11282008.PNG
2008, November 28
- Dmap11302008.PNG
2008, November 30
December
- Dmap20081201.PNG
2008, December 1
- 081202-danger-map.PNG
2008, December 2
- 081203-suburb-dangermap.PNG
2008, December 3
- 081204-suburb-dangermap.PNG
2008, December 4
Archive
- Screenshot galeries for current and previous months should be displayed, older - moved to the archive.
|
e Suburb DangerMap History Image Archive | ||||||||||||||||||||||||||||||||||||||||||||||||||||||||||||||||||||||||||||||||||||||||||||||||||||||||||||||||||||||||||||||||||
|
Map Records
For Days in which a record number of Ghost Town, Very Dangerous, or Safe Suburbs were reached
| Very Dangerous Suburbs | Safe Suburbs | Ghost Towns |
|---|---|---|
|
|
|
| Highest count: 72 | Highest count: 36 | Highest count: 13 |
|
|
|
| Lowest count: 3 | Final lowest count: 0 |


External Links
- 100 days in Urban Dead (video) - 100 days in Urban Dead, ending in 2007, November 25
- 200 days in Urban Dead (video) - The much awaited sequal, featuring double the content!