|
|
| (26 intermediate revisions by 15 users not shown) |
| Line 1: |
Line 1: |
| ==The DangerMap System==
| | {{TOCright}} |
|
| |
|
| [[Image:060318-suburb-dangermap.png|thumb|200px|before the Dangermap System]] | | This article explains the history of the DangerMap system. Individual image archives can be accessed below, or from [[:Category:Suburb History]]. |
| [[Image:080316-suburb-dangermap.png|thumb|200px|the Dangermap System style]]
| |
|
| |
|
| * '''Before'''
| | {{:Suburb/History/Navigation}} |
| :Before the current DangerMap system, the Urban Dead wiki had a 10x10 table with the names of every suburb, danger levels for each suburb shown as different colors for the borders of each cell. This style not only provided poor visual feedback for the users, but also was hard to maintain, since every danger level was hard coded into the table with HTML markup. This could lead to customized danger levels, such as purple or blue, or simply break the entire table. | |
| :While this system was highly inefficient, it was because it existed before the current DangerMap System was created.
| |
|
| |
|
| * '''First Version'''
| | ==The DangerMap System== |
| :The first version of the DangerMap system used the same old table to input the danger levels, but now it provided a better visual output for users. It no longer used hard coded HTML markup, but used a system based on templates. It also provided a way for users to timestamp their danger reports inside the table, which was not available in the previous version.
| |
| :While providing a better visual output, this table was also hard to maintain, and there was no integration with the suburb pages.
| |
| | |
| * '''Second Version'''
| |
| :The second version was created with two things in mind: to make it easy to update the table; and to provide a way to integrate the data from the DangerMap with the then recently created {{tl|suburb}} template. This system provided a way to update every cell of the table independently, by updating a user template that was created for each suburb. No longer were edit conflicts an issue when editing the DangerMap in the [[Suburbs]] page.
| |
| :With the data from the DangerMap system, it was now possible to provide not only the DangerMap system, but to automatically update the 9-suburb template on each suburb page. Other systems could be set up use the reports as they saw fit. One edited report could end up changing more than 10 pages.
| |
| :When this template was created, there was little knowledge about how the MediaWiki framework works, thus the templates for the danger levels of each suburb were stored as subpages of the {{usr|DangerReport}} user. Back then, the regular pages as templates exploit was thought to only work with pages inside the user namespace, and pages that abused this exploit didn't showed up in the used templates list when editing a page; this way when editing the [[Suburbs]] page a user wouldn't see the more than 100 templates being used in that page. After the MediaWiki framework was updated, however, this exploit became useless, causing several new users to ask themselves why the system was made this way.
| |
| | |
| * '''Current Version'''
| |
| :The third, and current, version displays content in exactly the same manner as its predecessor. The method of updating the {{usr|DangerReport}} pages was changed to use a new set of status templates, and make it easier for the user to update without error by providing visual feedback and instructions on the page, as opposed to the previous system where only the resulting formatting text was ever seen. The system also allows other pages and templates more flexibility in setting up their templates by allowing statuses to be directly referenced, as opposed to relying on the output text of the old template system which meant changes to such templates broke maps.
| |
| | |
| * '''The Danger Levels'''
| |
| :Initially the Second version, and all previous versions, only had four different danger levels: Safe, Moderate, Dangerous & Very Dangerous. The exact guidelines of when a suburb was at each one of these levels always created month-length discussions in the [[Talk:Suburb|Suburb talk page]], and there might still be ongoing discussions on it to change these guidelines. A fifth status was created in 2007: Ghost Town.
| |
| :A different set of templates is used for noteworthy suburbs. This set will bold the text for such noteworthy suburbs, indicating their importance.
| |
| | |
| * '''Critics'''
| |
| :While being a really helpful tool for the Urban Dead community, the Suburb DangerMap System has been criticized of being impartial, biased, exaggerated, and, on some occasions, outdated. Some of these criticisms might be true, since the system depends on user input based on an incomplete set of guidelines. A suburb can easily be Safe for someone and Dangerous for another, the difference being on where and how the players made the survey.
| |
| :Some of these criticisms may have been exacerbated by the way the danger map is used by some as a measure of a group's success in an area.
| |
| :The system was also prone to Propaganda. Some Survivors groups always tried to make their home suburbs appear safe in the DangerMap system, while zombies were trying to make them look Very Dangerous. Some users would use the system to provide misinformation, so that others would avoid dangerous burbs, or lure them to safe burbs that were actually being overrun by zombies.
| |
| :And, finally, since the system depends on user input, this requires people to live in the suburb and be an active user in the wiki. The southern suburbs often have their danger levels unchanged for long periods of time, since only a few group of survivors actually live in them, while the northern suburbs have their danger levels changed almost daily, due the constant history of sieges and battles that happens there.
| |
| | |
| <noinclude>
| |
| | |
| == The Record ==
| |
| | |
| This page was created for the sake of keeping track of the evolution of the danger levels of each suburb in Malton, keeping a record of screenshots taken from the [[Suburb|Suburb page]]. A partial archive of the suburb page can be found [http://web.archive.org/web/*/http://wiki.urbandead.com/index.php/Suburb here]; please make screen shots of it to fill the gaps in the record.
| |
| | |
| New monthly headers goes on the bottom.
| |
| | |
| ===Most Recent Screenshot===
| |
| [[Image:Dec72009.png]]
| |
| | |
| === 2009 ===
| |
| ====December====
| |
| <gallery>
| |
| Image:Dec12009.png|2009, December 1
| |
| </gallery>
| |
| | |
| ====November====
| |
| <gallery>
| |
| image:Nov1409.jpg|2009, November 14
| |
| Image:Nov1609.jpg|2009, November 16
| |
| Image:Nov202009.JPG|2009, November 20
| |
| </gallery>
| |
| | |
| ====July====
| |
| <gallery>
| |
| Image:July.04.09SuburbMap.JPG|2009, July 4
| |
| Image:2009.png|2009, July 9
| |
| </gallery>
| |
| | |
| ====June====
| |
| <gallery>
| |
| Image:June.15.09SuburbMap.JPG|2009, June 15
| |
| Image:June.16.09SuburbMap.JPG|2009, June 16
| |
| Image:June.18.09SuburbMap.JPG|2009, June 18
| |
| Image:June.19.09SuburbMap.JPG|2009, June 19
| |
| Image:June.21.09SuburbMap.JPG|2009, June 21
| |
| Image:June.23.09SuburbMap.JPG|2009, June 23
| |
| Image:June.25.09SuburbMap.JPG|2009, June 25
| |
| Image:June.28.09SuburbMap.JPG|2009, June 28
| |
| </gallery>
| |
| | |
| | |
| | |
| === Archive ===
| |
| :''Screenshot galleries for current and previous months should be displayed, older - moved to the archive.''
| |
| {{:Suburb/History/Navigation}}
| |
|
| |
|
| </noinclude>
| | [[Image:060318-suburb-dangermap.png|thumb|200px|Before the DangerMap System]] |
| | [[Image:080316-suburb-dangermap.png|thumb|200px|The DangerMap System style]] |
|
| |
|
| == Map Records == | | ===Before=== |
| For Days in which a record number of Ghost Town, Very Dangerous, or Safe Suburbs were reached
| | Before the current DangerMap system, the map was hardcoded onto the [[Suburb]] page and only the borders were used to show the danger. Being on one page lead to edit conflicts, and having to edit the style by hand was difficult and often resulted in a broken table or non-existent status colors. |
|
| |
|
| {| style="text-align:center"
| | ===First Version=== |
| |-
| | The first version of the DangerMap system moved the hardcoded table into a template, and allowed users to set styles via variables, as well as leaving timestamps for when a section had been updated. It still caused edit conflicts. |
| ! Very Dangerous Suburbs
| |
| ! Safe Suburbs
| |
| ! Ghost Towns
| |
| |-
| |
| | <!-- Highest Very Dangerous Suburbs Image -->
| |
| <gallery>
| |
| Image:17-04-08.JPG|2008, April 17
| |
| </gallery>
| |
|
| |
|
| | <!-- Highest Safe Suburbs Image --> | | ===Second Version=== |
| <gallery>
| | The second version gave each suburb its own page where you could enter a template that gave the correct formatting for the table. This also allowed the status to be transferred to other pages, such as the 9-suburb map which had recently been added to all the suburb pages using the {{tl|Suburb}} template. |
| Image:Suburbs 2-11-2009.PNG|2009, February 11
| | :Originally, people wanted the individual pages to not show up in the "Templates on this page" section while editing. At the time, pages inside the user namespace would not be shown in this list, so danger status pages were created as subpages of the user {{usr|DangerReport}}. After an update to a newer MediaWiki version, however, this exploit was fixed. |
| </gallery>
| |
|
| |
|
| | <!-- Highest Ghost Town Suburb Image -->
| | ===Current Version=== |
| <gallery>
| | The third, and current, version sets a variable inside a template to get the style you want. This allowed for real time feedback on what you entered, rather than obscure formatting text. The system was also made more flexible by allowing you to specify what template to use when calling the report, meaning you could create your own output rather than getting only style formatting back. |
| Image:Dec72009.png|2009, December 9
| |
| </gallery>
| |
| |-
| |
| | Highest count: '''72''' <!--Highest Very Dangerous Count-->
| |
| | Highest count: '''40''' <!--Highest Safe Count-->
| |
| | Highest count: '''16''' <!--Highest Ghost Town Count-->
| |
| |-
| |
| | <!-- Lowest Very Dangerous Suburbs Image -->
| |
| <gallery>
| |
| Image:080123-suburb-dangermap.png|2008, January 23
| |
| </gallery>
| |
|
| |
|
| | <!-- Lowest Safe Suburbs Image -->
| | ===The Danger Levels=== |
| <gallery>
| | Initially the second version, and all previous versions, only had four different danger levels: Safe, Moderate, Dangerous & Very Dangerous. The exact guidelines of when a suburb was at each one of these levels always created month-length discussions in the [[Talk:Suburb|Suburb talk page]]. A fifth status was created in 2007: Ghost Town. |
| Image:080325-suburb-dangermap.png|2008, March 25
| |
| Image:041208.PNG|2008, December 4
| |
| </gallery>
| |
|
| |
|
| |
| | A different set of templates is used for noteworthy suburbs. This set will bold the text for such noteworthy suburbs, indicating their importance. |
| |-
| |
| | Lowest count: '''3''' <!--Lowest Very Dangerous Count-->
| |
| | Final lowest count: '''0''' <!--Lowest Safe Count-->
| |
| |}
| |
| <div style="clear:both">
| |
|
| |
|
| ==External Links==
| | [[Category:Suburb History| {{PAGENAME}}]] |
| * '''[http://www.youtube.com/watch?v=ysG1pVR05aA 100 days in Urban Dead (video)]''' - 100 days in Urban Dead, ending in 2007, November 25, by {{usr|DanceDanceRevolution}}.
| |
| *'''[http://www.youtube.com/watch?v=yQLY1Xxktcg 200 days in Urban Dead (video)]''' - The much awaited sequal, featuring double the content!
| |
This article explains the history of the DangerMap system. Individual image archives can be accessed below, or from Category:Suburb History.
The DangerMap System

Before the DangerMap System
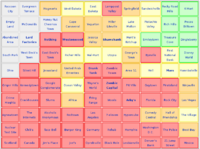
The DangerMap System style
Before
Before the current DangerMap system, the map was hardcoded onto the Suburb page and only the borders were used to show the danger. Being on one page lead to edit conflicts, and having to edit the style by hand was difficult and often resulted in a broken table or non-existent status colors.
First Version
The first version of the DangerMap system moved the hardcoded table into a template, and allowed users to set styles via variables, as well as leaving timestamps for when a section had been updated. It still caused edit conflicts.
Second Version
The second version gave each suburb its own page where you could enter a template that gave the correct formatting for the table. This also allowed the status to be transferred to other pages, such as the 9-suburb map which had recently been added to all the suburb pages using the {{Suburb}} template.
- Originally, people wanted the individual pages to not show up in the "Templates on this page" section while editing. At the time, pages inside the user namespace would not be shown in this list, so danger status pages were created as subpages of the user DangerReport. After an update to a newer MediaWiki version, however, this exploit was fixed.
Current Version
The third, and current, version sets a variable inside a template to get the style you want. This allowed for real time feedback on what you entered, rather than obscure formatting text. The system was also made more flexible by allowing you to specify what template to use when calling the report, meaning you could create your own output rather than getting only style formatting back.
The Danger Levels
Initially the second version, and all previous versions, only had four different danger levels: Safe, Moderate, Dangerous & Very Dangerous. The exact guidelines of when a suburb was at each one of these levels always created month-length discussions in the Suburb talk page. A fifth status was created in 2007: Ghost Town.
A different set of templates is used for noteworthy suburbs. This set will bold the text for such noteworthy suburbs, indicating their importance.

