Statistics: Difference between revisions
The Rooster (talk | contribs) No edit summary |
The Rooster (talk | contribs) No edit summary |
||
| Line 10: | Line 10: | ||
{{:Statistics/Graph Events}} | {{:Statistics/Graph Events}} | ||
==Suburb History== | |||
Snapshots of the suburb dangermap can be seen at [[:Category:Suburb History]]. An animated gif showcasing these images can be seen <span class="stealthexternallink">[http://wiki.urbandead.com/images/5/54/1001_Days_in_Urban_Dead.gif here]</span>. | |||
==Sources== | ==Sources== | ||
Revision as of 11:09, 16 June 2011
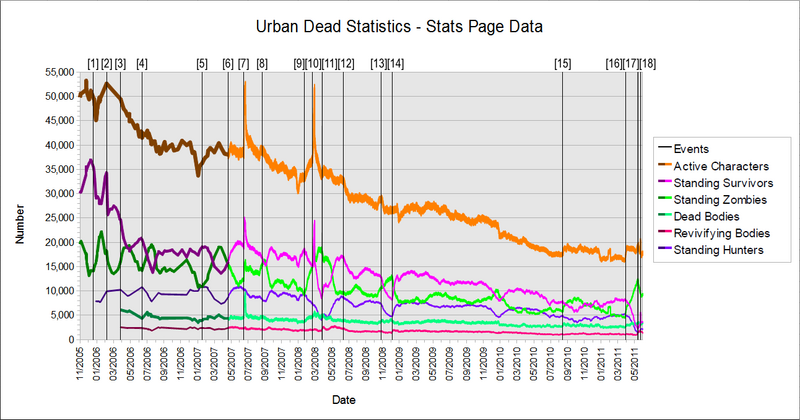
Statistics for the population of Malton. Pertinent historical events are noted where there has been a big change in trends.
Data before April 22, 2007 is from before logs began. This is shown by a darker line, upto April 22, 2007 when data begins to be gathered hourly. A lighter plot if used for these values.
The Standing Hunter count starts late as it included the count of zombies possessing the skill before that date, so it isn't comparable with the current method. The count of Dead and Revivifying Bodies start late as they was not separately tracked until that date.
A very detailed explanation on the trends of survivor and zombie numbers is provided in Survivor-Zombie Imbalance which also touches on some of the other statistics too.
Notable Events
|
Suburb History
Snapshots of the suburb dangermap can be seen at Category:Suburb History. An animated gif showcasing these images can be seen here.
Sources
- Game Statistics Page
- Game Statistics Log for comprehensive data post April 22, 2007
- Wayback Machine for sporadic data pre April 22, 2007
- Statistics/Data for a list of some manually recovered statistics, roughly every week for most of 2006.
