Statistics: Difference between revisions
(there, that's all the Malton population history until April 2020) |
|||
| (6 intermediate revisions by 3 users not shown) | |||
| Line 1: | Line 1: | ||
__NOTOC__[[File:SZI everything top.png|center]]<br>[[File:SZI everything bottom.png|center]] | |||
__NOTOC__ | |||
[[File:SZI everything top.png|center]]<br>[[File:SZI everything bottom.png|center]] | |||
| Line 7: | Line 5: | ||
<div style="width:600px;text-align:left"> | <div style="width:600px;text-align:left"> | ||
<big>'''Plot of [[Malton|Malton's]] populations, December 2005 to April 2020.'''</big><br> | <big>'''Plot of [[Malton|Malton's]] populations, December 2005 to April 2020.'''</big><br> | ||
The Y axes show various population categories. Active characters are those that haven't [[Inactive|idled]] out after five days. All below are subsets of active characters. Dead bodies include dead survivors and zombies, but not [[revivification|revivifying corpses]]. The [[headshot|zombie hunter]] count does not include hunters who are currently zombies themselves. | The Y axes show various population categories. Active characters are those that haven't [[Inactive|idled]] out after five days. All below are subsets of active characters. Dead [[dead body|bodies]] include dead [[Survivor|survivors]] and [[Zombie|zombies]], but not [[revivification|revivifying corpses]]. The [[headshot|zombie hunter]] count does not include hunters who are currently zombies themselves. | ||
Data from [http://www.urbandead.com/stats.csv Urban Dead statistics], April 2017 to current day. Older data from the [[Wikipedia:Wayback Machine|Wayback Machine]] was collected manually. | Data from [http://www.urbandead.com/stats.csv Urban Dead statistics], April 2017 to current day. Older data from the [[Wikipedia:Wayback Machine|Wayback Machine]] was collected manually. | ||
| Line 15: | Line 13: | ||
===Other graphs=== | |||
For graphs focusing on survivor and zombie population dynamics, see [[Survivor-Zombie Imbalance]]. An older version of the above graph is shown below. As well, the total population trend (outside of the scope of game imbalance) is also shown. | |||
[[Image:UD-Stats-Graph.png|800px|Urban Dead Statistics]] | |||
[[ | <div style="width:600px;text-align:left"> | ||
<big>'''Old plot of [[Malton|Malton's]] populations, November 2005 to May 2011.'''</big><br> | |||
Data before April 22, 2007 is from before logs began. This is shown by a darker line, up to April 22, 2007 when data begins to be gathered hourly. A lighter plot is used for these values. | |||
The Standing Hunter count starts late as it included the count of zombies possessing the skill before that date, so it isn't comparable with the current method; the first graph on this page nevertheless includes this earlier data from 2005. The count of dead and revivifying bodies start late as they was not separately tracked until that date. | |||
</div><small> | |||
{{:Statistics/Graph Events}} | {{:Statistics/Graph Events}} | ||
</small> | |||
[[File:Total population.png]] | |||
<div style="width:600px;text-align:left"> | |||
<big>'''Total population of [[Malton]], December 2005 to April 2020.'''</big><br> | |||
The steepness of the line corresponds to how many people signed up over a given time period. Events are labeled next to a dotted vertical line. Although [[Monroeville]] and [[Borehamwood]] statistics are not included on this graph, they are notable game events that attracted players to the game. | |||
An older version of this graph is available [[:File:SZI Graph Total Population.png|here]]. | |||
</div> | |||
<small> | |||
{| style="background:white; border:solid 1px #CCC;padding:5px" | |||
| '''Notable Events''' | |||
Chronologically, from left to right: | |||
# [[News/2006#March_28|Syringe Nerf]]. | |||
# [[Yahoomas]]. | |||
# The [[March of The Dead]]. | |||
# [[Monroeville]] opens. | |||
# [[Borehamwood]] opens. | |||
# The [[March of The Dead 2|Second March of The Dead]]. | |||
# Spike in [[zerging]] using new survivor character signups. | |||
# Unexplained uptick. An influx of total characters signal new creations, yet are ghosts: the active character numbers remain stable, as do other numbers on the stats page. | |||
# Spike in [[zerging]] using new zombie character signups. | |||
|} | |||
</small> | |||
===Group Statistics=== | |||
Data about the number of members of individual game groups can be found on the [[Group Statistics]] page. As with the population data, the group statistics were manually gathered from the Wayback Machine. Group and population data for the game is not backed up by the game server and is lost every time it is updated, so a great amount of population and group data has been lost. | |||
The official statistics page only lists groups with 10 or more active members, i.e players who performed an action in the last 5 days. According to the data saved by the WBM there have been exactly 1,100 groups that have had at least 10 members at one point in time. Many of these were short lived groups but there are several groups which have continued to play since the game began in 2005. This figure must be close to the true number of total groups because this wiki has 1,542 group related pages. | |||
The Ridleybank Resistance Front (RRF) is the only group which has never fallen below 10 active members, making it the oldest group in the game. | |||
The Dead hold the record for largest amount of members on a single date, 1,751 members on 1/5/2011. According to the server manager The Dead have a total group size of 7,266 if you take into account inactive players, a statistic that cannot be seen by regular players. | |||
__NOTOC__[[File:Top ninegroups2005to2022withoutthedead.png]]<br> | |||
The top 9 groups with the highest average membership from 2005 to 2022. | |||
===Suburb History=== | ===Suburb History=== | ||
| Line 33: | Line 73: | ||
==Sources== | ==Sources== | ||
* [http://www.urbandead.com/stats.html Game Statistics Page] | * [http://www.urbandead.com/stats.html Game Statistics Page] | ||
* [http://www.urbandead.com/stats.csv Game Statistics Log] for comprehensive data post April 22, 2007 | * [http://www.urbandead.com/stats.csv Game Statistics Log] for comprehensive data post April 22, 2007 | ||
| Line 40: | Line 79: | ||
[[Category:Statistics]] | [[Category:Statistics]] | ||
[[Category:History]] | |||
Latest revision as of 02:23, 23 January 2023


Plot of Malton's populations, December 2005 to April 2020.
The Y axes show various population categories. Active characters are those that haven't idled out after five days. All below are subsets of active characters. Dead bodies include dead survivors and zombies, but not revivifying corpses. The zombie hunter count does not include hunters who are currently zombies themselves.
Data from Urban Dead statistics, April 2017 to current day. Older data from the Wayback Machine was collected manually.
Other graphs
For graphs focusing on survivor and zombie population dynamics, see Survivor-Zombie Imbalance. An older version of the above graph is shown below. As well, the total population trend (outside of the scope of game imbalance) is also shown.

Old plot of Malton's populations, November 2005 to May 2011.
Data before April 22, 2007 is from before logs began. This is shown by a darker line, up to April 22, 2007 when data begins to be gathered hourly. A lighter plot is used for these values.
The Standing Hunter count starts late as it included the count of zombies possessing the skill before that date, so it isn't comparable with the current method; the first graph on this page nevertheless includes this earlier data from 2005. The count of dead and revivifying bodies start late as they was not separately tracked until that date.
Notable Events
|

Total population of Malton, December 2005 to April 2020.
The steepness of the line corresponds to how many people signed up over a given time period. Events are labeled next to a dotted vertical line. Although Monroeville and Borehamwood statistics are not included on this graph, they are notable game events that attracted players to the game.
An older version of this graph is available here.
| Notable Events
Chronologically, from left to right:
|
Group Statistics
Data about the number of members of individual game groups can be found on the Group Statistics page. As with the population data, the group statistics were manually gathered from the Wayback Machine. Group and population data for the game is not backed up by the game server and is lost every time it is updated, so a great amount of population and group data has been lost.
The official statistics page only lists groups with 10 or more active members, i.e players who performed an action in the last 5 days. According to the data saved by the WBM there have been exactly 1,100 groups that have had at least 10 members at one point in time. Many of these were short lived groups but there are several groups which have continued to play since the game began in 2005. This figure must be close to the true number of total groups because this wiki has 1,542 group related pages.
The Ridleybank Resistance Front (RRF) is the only group which has never fallen below 10 active members, making it the oldest group in the game.
The Dead hold the record for largest amount of members on a single date, 1,751 members on 1/5/2011. According to the server manager The Dead have a total group size of 7,266 if you take into account inactive players, a statistic that cannot be seen by regular players.

The top 9 groups with the highest average membership from 2005 to 2022.
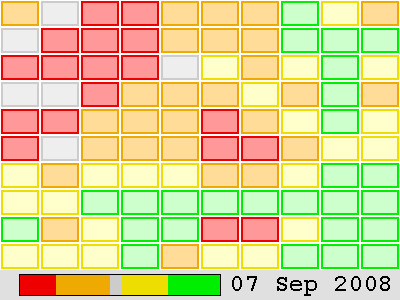
Suburb History
Snapshots of the suburb dangermap can be seen at Category:Suburb History. An animated gif showcasing these images can be seen here.
Sources
- Game Statistics Page
- Game Statistics Log for comprehensive data post April 22, 2007
- Wayback Machine for sporadic data pre April 22, 2007
- Statistics/Data for a list of some manually recovered statistics, roughly every week for most of 2006.