Survivor-Zombie Imbalance: Difference between revisions
(Probably going to rewrite this entire thing, apart from the featured graph (too tedious to do labeling in R and not much past 2016 to even note). More graphs to come. As always, feel free to add your 2 cents.) |
No edit summary |
||
| Line 1: | Line 1: | ||
<div style="position:fixed; left:10; background-color:white; padding:.5em">[[Survivor-Zombie Imbalance#1|'''TOP''']]<br>[[Survivor-Zombie Imbalance#2|'''INFO''']]<br>[[Survivor-Zombie Imbalance#3|'''CAV''']]<br>[[Survivor-Zombie Imbalance#4|'''WHY''']]<br><br>[[Survivor-Zombie Imbalance#5|'''EDV''']]<br><font color='lightgrey'>2005<br>2006</font><br><br>[[Survivor-Zombie Imbalance#6|'''TS''']]<br>[[Survivor-Zombie Imbalance#.C2.A02007|2007]]<br>[[Survivor-Zombie Imbalance#.C2.A02008|2008]]<br>[[Survivor-Zombie Imbalance#.C2.A02009|2009]]<br>[[Survivor-Zombie Imbalance#.C2.A02010|2010]]<br>[[Survivor-Zombie Imbalance#.C2.A02011|2011]]<br><br><br>[[Survivor-Zombie Imbalance#7|'''TLT''']]<br>[[Survivor-Zombie Imbalance#.C2.A02012|2012]]<br>[[Survivor-Zombie Imbalance#.C2.A02013|2013]]<br>[[Survivor-Zombie Imbalance#.C2.A02014|2014]]<br>[[Survivor-Zombie Imbalance#.C2.A02015|2015]]<br>[[Survivor-Zombie Imbalance#.C2.A02016|2016]]<br>[[Survivor-Zombie Imbalance#.C2.A02017|2017]]<br>[[Survivor-Zombie Imbalance#.C2.A02018|2018]]<br>[[Survivor-Zombie Imbalance#.C2.A02019|2019]]<br>[[Survivor-Zombie Imbalance#.C2.A02020|2020]]<br><br>[[Survivor-Zombie Imbalance#8|'''CONC''']]</div> | |||
|- | =====<font color=white>1</font>===== | ||
| | {| | ||
|- | | width="40px" style="border-right:solid 1px white;color:white" | ........... || style='padding-left:10px' | [[File:Survivor-Zombie Ratio.png]] | ||
| | |||
| | |||
<center> | <center> | ||
<div style=" | <div style="width:600px;text-align:left"> | ||
[[ | <big>'''The Survivor / Zombie Ratio, December 2005 to April 2020.'''</big><br> | ||
The Y axis shows the ratio of survivors to zombies, with the dashed horizontal line at 1:1 indicating an equal number of survivors to zombies. Above the line favours survivors (e.g., 2:1 means two survivors for every one zombie). Below the line favours zombies. The tick marks on the X axis indicate the start of the year named below. At each time point (day), the ratio is the number of survivors divided by the number of zombies, collected at the 0:00 hour of the day.<sup>1</sup> The extra info on either side of the dashed horizontal line has some caveats.<sup>2</sup> | |||
Data obtained from [http://www.urbandead.com/stats.csv Urban Dead statistics], April 2017 to current day. Older data from the [[Wikipedia:Wayback Machine|Wayback Machine]] was collected manually.<sup>3</sup> | |||
</div> | </div> | ||
</center> | </center> | ||
== | =====<font color=white>2</font>===== | ||
<Big><big><big>'''INTERPRETING THE GRAPHS'''</BIG></big></big> | |||
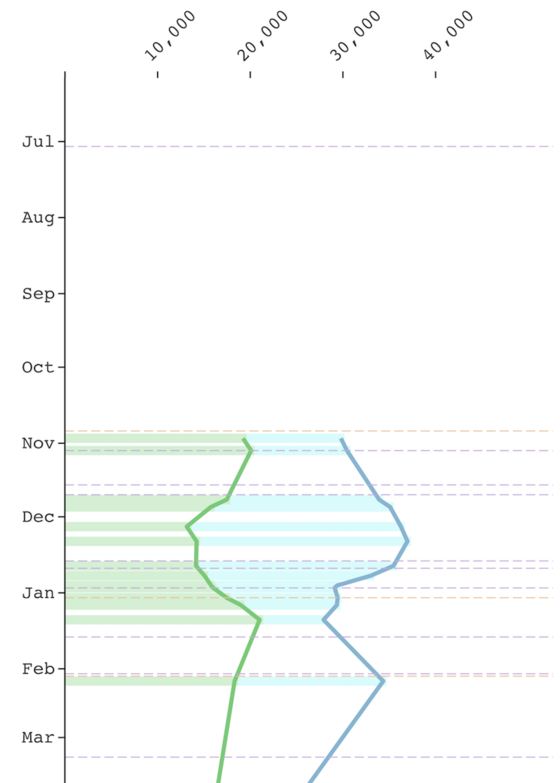
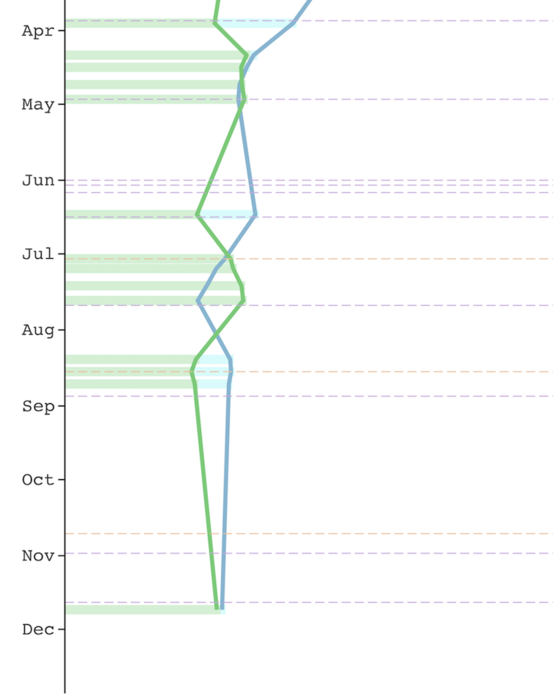
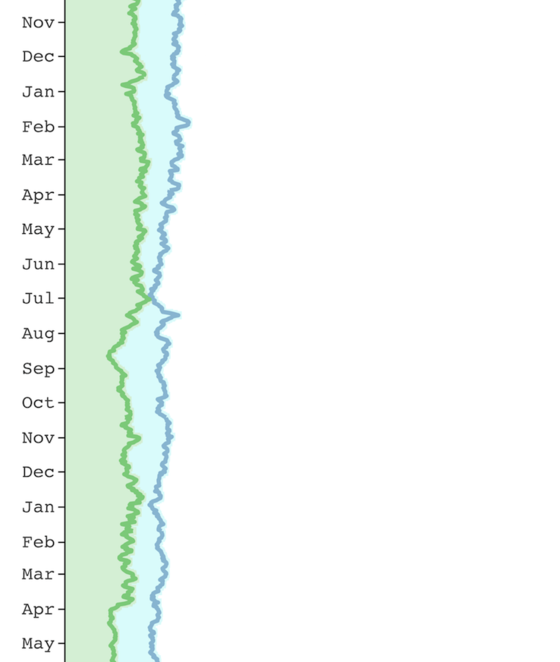
The first graph shows the survivor-zombie ratio. The graph below shows the absolute survivor and zombie populations in a series of three parts: Early Day Volatility (EDV), The Swings (TW), and The Long Tail (TLT).<sup>4</sup> These graphs go in-depth, listing most game updates and a small number of player-initiated events. While the game updates are listed regardless of their impact on the survivor-zombie ratio, partly due to the relative infrequency of the updates, the player events are (usually) listed if they seem to be responsible for a shift in the survivor-zombie ratio. | |||
An underlying assumption is that the ratio only changes if a force acts on it, be it a game update or player event. Although it often seems "obvious" that a game update or player event caused a shift in the ratio, it is impossible to identify all player events occurring at a given time; not all have been [[:Category:History|written into history]]. And given a specific time point, multiple events could be happening at the same time. How do we determine the degree to which each event influenced the ratio? | |||
Sometimes, however, an event is [[March of The Dead 2|so large]] that it undeniably caused a change in the ratio. Call it a [[Wikipedia:natural experiment|natural experiment]]. | |||
All that said, '''the purpose of the following in-depth graph is to chronicle the game balance over the years, without pointing too many fingers.''' | |||
=====<font color=white>3</font>===== | |||
<big><big>CAVEATS</big></big> | |||
{| | |||
| width='5px' style='vertical-align:top' | <sup>1</sup> || style='padding-top:5px' | Urban Dead's statistics updates its data on every hour of the day, yet characters only seem to [[idle|idle out]] on the 00:00 hour of the day. This creates a "climbing" effect where the data increases throughout the day until it hits the 00:00 mark and drops. For simplicity, data from other timepoints were excluded. (Note that the Urban Dead statistics page missed its mark a few times, and thus on certain days the data was collected on the 00:01 and 0:02 timepoints.) | |||
|- | |||
| width='5px' style='vertical-align:top' | <sup>2</sup> || style='padding-top:5px' |The percentage of days favouring either survivors or zombies was calculated by counting out the days when the ratio was above or below 1. The ratio never equals exactly 1, at least for the data shown here (see Caveat 1). To calculate the average ratio when the game favoured either survivors or zombies, the data was cut into two parts: one with the ratio above 1 (survivor favoured) and the other with the ratio below 1 (zombie favoured). Keep in mind, error exists because the data is sporadic before April 2007 (see Caveat 3). | |||
|- | |||
| width='5px' style='vertical-align:top' | <sup>3</sup> || style='padding-top:5px' |Only 28 data points are plotted before late April 2007; 4,732 points are plotted afterward. You can see the effect this has on the graph of the Survivor-Zombie Ratio due to the oddly straight lines, as opposed to the "noisy" line thereafter. On the in-depth graph below, all the columns of white space are locations of missing data. When calculating the facts discussed in Caveat 2, the data is more heavily weighed after April 2007; there's simply more data there that "drowns out" the scant data before it. Thus, these facts are an approximation. | |||
|- | |||
| width='5px' style='vertical-align:top' | <sup>4</sup> || style='padding-top:5px' |The scales are different on each part of the graph, which helps readability when the player populations become smaller. | |||
|- | |||
| width='5px' style='vertical-align:top' | || style='padding-top:5px' |One final caveat: this page is mostly the opinion of [[User:A Helpful Little Gnome|one person]]. | |||
|} | |||
== | =====<font color=white>4</font>===== | ||
<big><big>WHY ISN'T [INSERT EVENT HERE] ON THE GRAPH?</big></big> | |||
== | The graph maker may have missed an important game event (and it should be included). But it's also important to minimize the number of events and game updates on the page, as there's only so much room available. Larger scale events, such as roaming hordes and "big picture" moments in history (e.g., protests) are typically included. While some events clearly had no impact on the ratio, such as [[The Big Bash 4]], they are still listed here. This is mainly included for the reader's interest, since the earlier versions of events tended to have a stronger impact. | ||
< | |||
A few [[cities|second city]] events are included for interest, even though their respective populations are not present in [[Malton|Malton's]] statistics. Some of the simpler or cosmetic game updates are also not mentioned, such as bug fixes, server upgrades, and unofficial changes ([[News/2005#December_18|example]]). | |||
< | |||
=====<font color=white>5</font>===== | |||
<BIG><BIG><BIG>'''EARLY DAY VOLATILITY'''</BIG></BIG></BIG><br><big>Plot of <font color='#98c1d9'>'''Survivor'''</font> and <font color='#8bd08b'>'''Zombie'''</font> populations. <br>2005 to 2006.</big> | |||
<div style="width:560px">The first year or so of Urban Dead's history was marked by rapid game updates, establishing fundamental mechanics that flattened the ratio close to equality. These changes came quickly on the heels of social upheaval, the kind consisting of protests, violent riots, and roaming zombie hordes. It was an energetic, though uncertain time.</div> | |||
{| | {| | ||
| width='100px;position:absolute' | [[File:oneone.png|560px]][[File:onetwo.png|560px]]|| style="vertical-align: top; width:600px;position:absolute" | | |||
<big><big><span style='line-height:47px'>'''2005'''</span></big></big> | |||
{| style='padding-top:6px' | |||
|'''July 3rd.''' [[Urban Dead]] goes live. [[News/2005|Between now and October 27th]]: | |||
|} | |||
* Survivors can [[speak]] and zombies have begun to make [[Death_Rattle#Death_Rattle|noises]]. | |||
* [[Wirecutters]] have a use and survivors can jump out of windows. | |||
* [[Zerging|Zergers]] are now punished semi-automatically. | |||
* Survivors only get half the XP for [[PKer|attacking each other]], compared to attacking zombies. | |||
* [[First Aid Kits]] can be used on other players, and [[Dna_extractor#DNA_Extractor|DNA Extractors]] on zombies. Survivors have begun tagging buildings with [[graffiti|messages]], as well as [[construction|barricading]] them. Survivors have gotten [[body building|tougher]]. | |||
* Players may begin the game as a [[corpse]]. | |||
* New zombies move more slowly, requiring 2AP without the [[Lurching Gait]] skill. They also forget how to [[Zombie_Skills/Memories_of_Life|open doors]]. | |||
* [[Dead bodies]] can now be dumped out of buildings. Experienced survivors are [[Zombie Hunter|hunting zombies]]. All survivors are also getting better at hitting zombies, which now need 10 AP to stand up again. | |||
* Players now have a [[contacts|contact list]]. Headshots reduce some XP, instead of removing all of it. | |||
{| style='padding-top:18px' | |||
|'''October 27th.''' [[First Siege of Caiger Mall]]. [[Statistics|Game statistics]] first available. | |||
|- | |||
| <span style='line-height:14px'>'''November 4th.''' [[Profile|Profiles]] are now editable.</span> | |||
|} | |||
{| style='padding-top:11px' | |||
|'''November 18th & 22nd.''' The power is on. Survivors are now hooking up buildings with [[generators]], which doctors are using to perform [[Surgery#List_of_Scientific_skills|surgery]]. A few days later, the [[Mobile Phone Mast|mobile phone network]] reactivated. | |||
|} | |||
{| style='padding-top:12px;' | |||
| rowspan="2" width="75px" style='border-right: solid 1px grey' | <big><big>'''2006'''</big></big> || style='padding-left:5px' | '''December 19th, 22nd, & 30th.''' [[News/2005#December_19|Another change to headshot]] serves as a launching point for players to go [[On Strike]]. Later in the month, [[User:Kevan|Kevan]] adds [[Zombie Skills/Feeding Groan|feeding groan]] and opens [[large building|large buildings]] to movement. | |||
|- | |||
| style='padding-left:5px;border-top: dashed 1px grey' | '''January 3rd. & 19th.''' Stemming from the protests last month, Malton's [[Mall Tour '06|first mall tour forms]]. Hundreds of zombies storm the city's malls and brings them to ruin. Under the cover of battle, scientist discover how to revive [[brain rot|brain rotten zombies]]. | |||
|} | |||
{| style='padding-top:7px;' | |||
| '''February 3rd & 4th.''' [[tangling grasp|Tangling Grasp]] is added. The Mall Tour '06 sets its sights on Caiger Mall, leading to an exhausting [[Second_Siege_of_Caiger_Mall|siege]] that ends in a zombie defeat as March closes. | |||
|} | |||
{| style='padding-top:39px;' | |||
| '''March 9th.''' Zombies can now recognize the groans of members of their own [[group|horde]]. | |||
|} | |||
{| style='padding-top:20px;' | |||
| '''March 28th.''' Syringe nerf. Revivifying zombies takes 10 AP, up from 1. | |||
|} | |||
{| style='padding-top:25px;' | |||
| '''April 28th.''' Some of the more belligerent (or forward-thinking) zombies have begun [[ransack|ransacking]] buildings. Survivors have finally figured out how to shine the light in powered buildings to where the loot is, improving [[search odds]]. | |||
|} | |||
{| style='padding-top:15px;' | |||
| '''June 1st, 3rd & 6th.''' A series of communication-related updates give a use to [[radio|handheld radios]] but restrict the 26.00 - 28.00 MHz band to [[Radio_operators#Radio_Operation|skilled operators]]. Zombies can [[Zombie Skills/Scent Death|smell]] distant hordes and bodies. | |||
|} | |||
{| style='padding-top:0px;' | |||
| '''June 16th.''' Critically-wounded survivors are now at risk of being [[feeding Drag|dragged]] from buildings by hungry zombies. Ransacked buildings must now be cleared of zombies before survivors can barricade them. '''July 3rd.''' Following in the footsteps of last year's strike and the mall tour, the first [[The Big Bash|Big Bash]] forms, eating the eastern and southern portions of Malton before blending with the next year's [[Mall Tour '07|mall tour]]. | |||
|} | |||
{| style='padding-top:5px;' | |||
| '''July 18th.''' DNA-Extractors provide profile info and allow the survivor to immediately revive the zombie. | |||
|} | |||
{| style='padding-top:37px;' | |||
| '''August 18th & 28th.''' Survivors gain an unlikely foothold in the zombie homeland of [[Ridleybank]], turning into a two month siege, the [[Battle of Blackmore]], at the suburb's only [[NecroTech Building]]. Although frequently outnumbering the zombies, the survivors eventually succumb to a [[Shacknews|coordinated attack]] on October the 13th. Later in August, survivors become more effective with knives, while the zombie sense of death sharpens and have learned to make crude, [[flailing gesture|flailing gestures]]. | |||
|} | |||
{| style='padding-top:60px;' | |||
| '''October 23rd.''' [[Caiger Mall]] falls to zombies for [[Third Siege of Caiger Mall|the first time]]. | |||
|} | |||
{| style='padding-top:0px;' | |||
| <span style='line-height:10px'> '''October 31st.''' Malton's first [[fog]]. Players cannot see outside their current location until dawn tomorrow.</span> | |||
|} | |||
{| style='padding-top:28px;' | |||
| '''November 20th.''' The external military repairs Malton's two forts, patching holes in the walls and leaving the only entrances at the gatehouse. | |||
|} | |||
|- | |||
| | |||
=====<font color=white>6</font>===== | |||
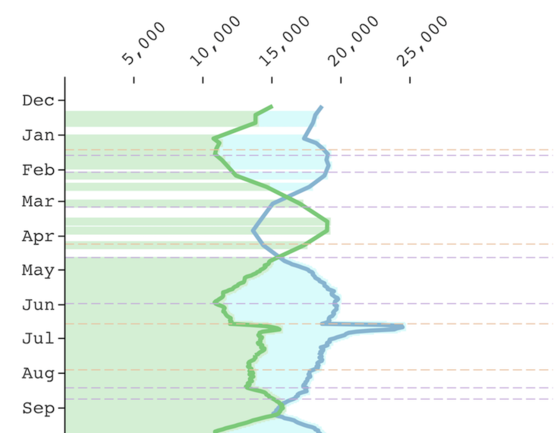
<br><BIG><BIG><BIG>'''THE SWINGS'''</BIG></BIG></BIG><br><big>Plot of <font color='#98c1d9'>'''Survivor'''</font> and <font color='#8bd08b'>'''Zombie'''</font> populations. <br>2007 to Mid 2011.</big> | |||
<div style="width:560px">While the ratio tries to stabilize at 3:2 in favour of survivors, mega hordes repeatedly swing the ratio back in favour of zombies... mainly by eating the humans. At the same time, crucial zombie game updates add potency to coordinated zombies who siege buildings and hold territory. Hence, "The Swings." </div> | |||
|- | |||
| width='100px' | [[File:twoone.png|560px]][[File:twotwo.png|560px]][[File:twothree.png|560px]][[File:twofour.png|560px]] || style="vertical-align: top;padding-top:65px;width:600px;position:absolute" | | |||
=== <span style='line-height:8px'>'''2007'''</span>=== | |||
{| style='padding-top:8px' | |||
|'''January 14th, 19th & February 3rd.''' [[Mall Tour '07]] begins. New skills enables zombies to detect [[Scent Blood|infected survivors]] and [[Scent Death|locate nearby horde members]]. Around this time, [[X:00]] tactics is developed. In early February, zombies get XP for de-barricading, ransacking buildings, and destroying machinery. '''March 6th.''' Survivors begin the useless pastime of collecting and exhibiting [[decorations|museum decorations]]. | |||
|} | |||
{| style='padding-top:10px' | |||
|'''April 8th & 20th.''' [[The Battle of Santlerville]], which lasts deep into May, sweeps the [[Santlerville|suburb]]... until the zombie invasion disperses in defeat. Some quality of life changes to profiles allow, among other things, for survivors to auto-discard unwanted items. | |||
|} | |||
{| style='padding-top:0px' | |||
|<span style='line-height:13px'>'''May 31st.''' Survivors start wearing [[clothes|clothing]], ending an era of dangly bits for zombies to grab hold of.</span> | |||
|} | |||
{| style='padding-top:0px' | |||
|'''June 18th.''' Yahoo publishes an article on Urban Dead, prompting over 10,000 players to join in days. Clueless level 1 survivors wander the streets, eaten and idling out in the coming weeks. | |||
|} | |||
{| style='padding-top:0px' | |||
|'''July 29th.''' Though easily mistaken for a typo, zombies clench the [[Battle of SantLUEville]] in victory. | |||
|} | |||
{| style='padding-top:0px' | |||
|'''August 14th & 24th.''' The more territorial zombies can [[ruin]] buildings, needing a toolbox to repair. By next week, even the more agile survivors are slipping on the rubble of ruined buildings, preventing freerunning. Survivors tuning into the right channel can now catch [[EMRP|external military reports]]. | |||
|} | |||
{| style='padding-top:0px' | |||
|<span style='line-height:10px'>'''October 10th.''' The [[Second Big Bash]] begins, again wrecking the city's eastern and southern regions. | |||
|} | |||
=== <span style='line-height:0px'>'''2008'''</span>=== | |||
{| style='padding-top:9px' | |||
|'''January 2nd & 23rd.''' The Second Big Bash hits a month long [[Battle of Pitneybank|siege at Pitneybank]]. A controversial and incredibly influence game update in the third week of fighting, [[interference|barricade interference]], makes holding [[Giddings Mall]] and other tactical locations against the [[Beachhead Tactic|zombie beachheads]] untenable. <br/>'''February 25th & 28th.''' While a second city, [[Monroeville]], opens, a massive, [[The Dead|world-ending horde]] fuelled by an [[Wikipedia:Something Awful|external forum]] [[March of The Dead|marches on the city]]. The survivor population drops to 31%, the lowest to-date. <br/>'''March 28th.''' [[Monroeville]] is quarantined, blocking character creation. Headshot becomes permanent. | |||
|} | |||
{| style='padding-top:46px' | |||
|<span style='line-height:10px'>'''May 28th.''' [[Decay]] sets in, making ruined buildings more costly to repair.</span> | |||
|} | |||
{| style='padding-top:0px' | |||
|'''June 13th.''' [[Monroeville]] reopens, closing forever only four weeks later. | |||
|} | |||
{| style='padding-top:55px' | |||
|'''August 25th.''' Only [[The Monroeville 100|100 survivors remain in Monroeville]]. | |||
|} | |||
{| style='padding-top:39px' | |||
|<span style='line-height:1px'>'''October 14th.''' Zombies get the [[flesh Rot|flesh rot]] skill, [[digestion]], and mall [[FAK]] rates are nerfed.</span> | |||
|} | |||
{| style='padding-top:0px' | |||
|'''October 28th.''' [[Borehamwood]], another playable map, opens. | |||
|} | |||
{| style='padding-top:5px;padding-bottom:5px' | |||
|'''November 28th.''' A month later, [[Borehamwood]] closes forever. | |||
|} | |||
=== <span style='line-height:0px'>'''2009'''</span>=== | |||
{| style='padding-top:0px' | |||
|<span style='line-height:0px'>'''January 9th.''' [[Mall Tour '09]] begins, then demolishes most of [[Malton]]'s malls.</span> | |||
|} | |||
{| style='padding-top:10px' | |||
|'''February 7th.''' The [[The Borehamwood 100|last 100 survivors in Borehamwood]] pick their way through the rubble and empty countryside. | |||
|} | |||
{| style='padding-top:119px' | |||
|'''July 3rd.''' Groans made inside closed doors are now muffled. Survivors find the old, [[Emergency Broadcast System]] hidden in [[the Coram Building]]. | |||
|} | |||
=== <span style='line-height:0px'>'''2010'''</span>=== | |||
{| style='padding-top:162px' | |||
|'''June 1st & 3rd.''' Hundreds of players congregate at [[Ellicott Place Railway Station]], adjacent to [[border|Malton's border]]. The plan: [[Escape]]. The outcome: nothing in particular. Shortly after, [[Big Bash 3|The Big Bash 3]] begins shambling across the city, putting an end to what they believe is a fatal condition called "breathing." | |||
|} | |||
{| style='padding-top:22px' | |||
|'''August 16th.''' The last game mechanics update. Survivors receive a niche, rarely useful skill: [[Scout Safehouse]]. Zombies also receive a niche, though slightly more useful skill: [[Bellow]]. | |||
|} | |||
=== <span style='line-height:0px'>'''2011'''</span>=== | |||
{| style='padding-top:65px' | |||
|'''March 27th (ish).''' The world almost ends again. [[The Dead 2.0|The Dead]] [[March of The Dead 2|march on Malton for a second time]], leading to the most drastic population inequality in Malton's (recorded) history.* Survivor numbers plummet to its lowest in mid May, settling at 15%. Efforts to reduce this percentage even lower, preferably to 0%, are met with massive resistance from a key game mechanic: syringe search rates depend on the survivor-zombie ratio. The low relative abundance of survivors allow them to easily find syringes, even in ruined [[NecroTech|NecroTechs]]. Eventually, The Dead lose steam, leading to The Long Tail. | |||
<small>* Technically, the first day of Malton's history (July 3rd, 2005) would have favoured survivors completely, as initially players could not start the game as [[News/2005#July_19|corpses until mid July]].</small> | |||
|} | |||
|- | |- | ||
| | | | ||
=====<font color=white>7</font>===== | |||
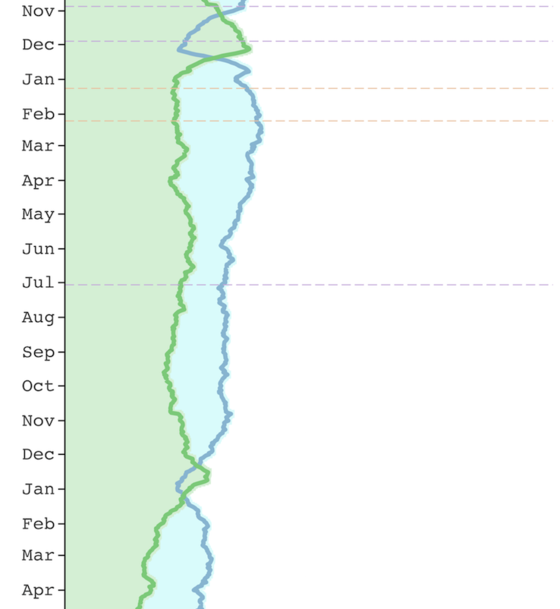
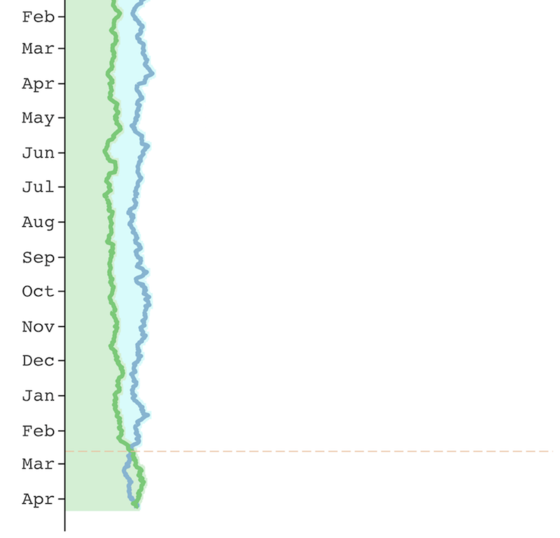
<br><BIG><BIG><BIG>'''THE LONG TAIL'''</BIG></BIG></BIG><br><big>Plot of <font color='#98c1d9'>'''Survivor'''</font> and <font color='#8bd08b'>'''Zombie'''</font> populations. <br>Mid 2011 to 2020.</big> | |||
<div style="width:560px">The lack of player events and game updates stagnates the game. It also provides convincing evidence that the "default" ratio is about three survivors for every two zombies, or about 60% survivors and 40% zombies. That is, unless something disrupts it.</div> | |||
|- | |- | ||
| [[File: | | width='100px' | [[File:threeone.png|560px]][[File:threetwo.png|560px]][[File:threethree.png|560px]][[File:threefour.png|560px]][[File:threefive.png|560px]][[File:threesix.png|560px]] || style="vertical-align: top; width:600px;position:absolute" | | ||
<big><big><span style='line-height:0px'>'''2011 <small>(continued)</small>'''</span></big></big> | |||
{| style='padding-top:46px' | |||
|'''October 3rd.''' Malton's last [[Mall Tour '11|mall tour]]. Although the late stage of the game tempers the size of the horde, survivors fare far worse. The malls–nearly empty, nearly ruined, or ruined already–fall easily to the horde. | |||
|} | |||
=== <span style='line-height:0px'>'''2012'''</span>=== | |||
{| style='padding-top:0px' | |||
|The first year in Urban Dead's history when nothing in particular happens. At least according to this graph, anyway. | |||
|} | |} | ||
== | |||
=== <span style='line-height:26px'>'''2013'''</span>=== | |||
{| style='padding-top:140px' | |||
|'''June 1st.''' [[Big Bash 4|The Big Bash 4]], the last bash and the last player event on this graph. This Bash is gravely concerned for survivor safety; survivors, who for a moment believe the zombies have their best interests in mind, quickly realize the zombies feel they are ''too'' safe. In other words, many zombies eat many survivors. | |||
|} | |||
=== <span style='line-height:0px'>'''2014'''</span>=== | |||
<font face=white>.</font> | |||
=== <span style='line-height:28px'>'''2015'''</span>=== | |||
{| style='padding-top:192px' | |||
|'''July 3rd.''' On Urban Dead's birthday, [[User:Kevan|Kevan]] opens up [http://www.urbandead.com/survey.cgi the State of the Apocalypse Survey]. The survey asked what suggestions you would add, the flavour and gameplay changes you are interested in, and what you like best and least. The results were never officially released, nor leaked surreptitiously. Kevan never appeared to act on the results, so far as anyone can tell. | |||
|} | |||
=== <span style='line-height:0px'>'''2016'''</span>=== | |||
<font face=white>.</font> | |||
=== <span style='line-height:0px'>'''2017'''</span>=== | |||
{| style='padding-top:332px' | |||
|'''November 3rd.''' Mass [[zerging]]. It is so obvious that it can be seen from space (i.e., this graph). Zombie numbers spike roughly 1,300 over two days, then plummet on the third. Levels of normal and revivifying bodies remain untouched, as do survivors, suggesting the zombies were banned en masse. | |||
|} | |||
=== <span style='line-height:0px'>'''2018'''</span>=== | |||
<font face=white>.</font> | |||
=== <span style='line-height:0px'>'''2019'''</span>=== | |||
<font face=white>.</font> | |||
=== <span style='line-height:0px'>'''2020'''</span>=== | |||
{| style='padding-top:46px' | |||
|'''February 19th.''' For the first (legitimate) time since the Dead's second march in 2011, the ratio favours zombies. Nevertheless, the shift towards zombies is small and survivors regain their ground in April. | |||
|} | |||
|} | |||
=====<font color=white>8</font>===== | |||
<Big><big><big>'''CONCLUSION'''</BIG></big></big> | |||
The ratio stabilized as time went on. By The Long Tail, there were three survivors for every two zombies. (To be precise, it's an average of 1.55 survivors per zombie over the entire game history.) Is this a sign of game imbalance? | |||
Of course, "it depends." What things ''should'' look like is an opinion (pick one, none, or more): | |||
*'''Equal numbers of zombies and survivors'''. This is the most "on the nose" interpretation of game balance. It implies that if survivors are more numerous, they are stronger than zombies (and vice versa). Typically this takes the form of one side being more efficient with AP, whether its killing the opposing side, revivifying them, or barricade dynamics. | |||
*'''Zombies heavily outnumber survivors'''. The most in-genre, and some believe this is a way to [[end of the game]]. While it presents both great danger and excitement for survivors, it runs the risk of creating frustration in survivors who stay dead for long periods of time and for zombies who find nothing to munch on. The self-correcting nature of revivification rates through [[Syringe#NecroTech_Revivification_Syringe|syringe search odds]], as well as [[Imagine/DIRT:NAP|Dirt Nap]] tactics and new characters signing up, makes this scenario unlikely to hold up over the long term. | |||
*'''An unstable ratio.''' Sometimes survivors outnumber zombies. Sometimes zombies outnumber survivors. The game might be the most fun if the ratio never stabilizes over the long term. | |||
*'''Let it be (Laissez-faire)'''. In other words, don't alter the game mechanics and let the ratio go wherever it will. ''This is the current state of the game.'' | |||
The opinion of this author: the ratio favours survivors because they have more things to do and are more fun to play. The [[Action Points|AP]] efficiency of actions is secondary to this. The fact that players choose the side they want to play damages the idea that AP efficiency is the cause for the relative overabundance of survivors... with the exception of the few and far between [[Dual Nature]] players. | |||
Consider game [[Wikipedia:chemical equilibrium|equilibrium]]. Whenever a survivor is killed, they become zombies until they are revived. The rate at which survivors go through this process depends on how much AP it takes to kill them, to find syringes, find survivors to revive, and then revive them. But the game balance cannot be reduced to the math of AP efficiency. If dead survivors ''want'' to be alive, they [[Mrh Cow|go to revive points]], get revived, and try not to die again. This increases the rate at which survivors are revived, but it is based on player preference rather than the direct cost of AP. To drive the point home, if every player suddenly decides they only want to be zombies, then they purchase [[brain rot]] or jump out of buildings. This would greatly slow the rate at which zombies become survivors, increasing the relative abundance of zombies. If we really wanted to know how balanced the game is from an AP efficiency perspective, everyone would need to play as Dual Nature. | |||
<Big><big><big>'''OLDER GRAPHS'''</BIG></big></big> | |||
{| | |||
|- | |||
| [[File:SZI Graph.png|Survivor (<font color="#4491C4">blue</font>) and zombie (<font color="#5BBA5C">green</font>) populations from October 2005 to May 2016. Dips and peaks correspond to notable player [[:Category:Events|events]] (names) and [[News|game updates]] (numbers).|thumb|400px]] || [[File:Barhah.jpg|September 2005 to April 2009. [[A Brief History Of Barhah]] compares population statistics with a timeline of sieges and zombie campaigns.|thumb|400px]] | |||
|- | |||
| [[File:UD-SZI-Relative-Graph.png|November 2005 to May 2011 relative graph. By using the percentage of each, one can see changes independent of the ever changing total active population and some effects which are more well hidden on the absolute values become obvious here.|thumb|400px]] || [[File:UD-SZI-Absolute-Graph.png|November 2005 to May 2011 absolute graph. This shows the actual changes in standing numbers over time, the magnitude of keys events can be seen easily.|thumb|400px]] | |||
|} | |||
<Big><big><big>'''SEE ALSO'''</BIG></big></big> | |||
* [[Statistics]] | |||
* [[Timeline]] | |||
* [[UDWiki:Project Timeline]] | |||
* [[News]] | |||
* [[Game Balance]] | |||
* [[Equilibrium]] | |||
* [[Game Assumptions]] | |||
* See [[Survivor-Zombie Imbalance/Ratio History|Ratio History]] for descriptions of notable ratio changes. Mostly pre-2010. | |||
* Odd Starter's [[User:Odd_Starter/On_the_imbalance_of_Survivors_and_Zombies|On the imbalance of Survivors and Zombies]] | |||
* Grim s 's [[User:Grim s/Rants/Revival Imbalance|Revival Imbalance]] | |||
* [[:Category:History]] | |||
* [http://www.urbandead.com/stats.html Game Statistics Page] | * [http://www.urbandead.com/stats.html Game Statistics Page] | ||
* [http://www.urbandead.com/stats.csv Game Statistics Log] for comprehensive data post April 22, 2007 | * [http://www.urbandead.com/stats.csv Game Statistics Log] for comprehensive data post April 22, 2007 | ||
* [http://web.archive.org/web/*/http://www.urbandead.com/stats.html Wayback Machine] for sporadic data pre April 22, 2007 | * [http://web.archive.org/web/*/http://www.urbandead.com/stats.html Wayback Machine] for sporadic data pre April 22, 2007 | ||
__TOC__ | |||
__NOEDITSECTION__ | |||
Revision as of 13:58, 23 June 2020
1
| ........... | 
The Survivor / Zombie Ratio, December 2005 to April 2020. Data obtained from Urban Dead statistics, April 2017 to current day. Older data from the Wayback Machine was collected manually.3
2INTERPRETING THE GRAPHS The first graph shows the survivor-zombie ratio. The graph below shows the absolute survivor and zombie populations in a series of three parts: Early Day Volatility (EDV), The Swings (TW), and The Long Tail (TLT).4 These graphs go in-depth, listing most game updates and a small number of player-initiated events. While the game updates are listed regardless of their impact on the survivor-zombie ratio, partly due to the relative infrequency of the updates, the player events are (usually) listed if they seem to be responsible for a shift in the survivor-zombie ratio. An underlying assumption is that the ratio only changes if a force acts on it, be it a game update or player event. Although it often seems "obvious" that a game update or player event caused a shift in the ratio, it is impossible to identify all player events occurring at a given time; not all have been written into history. And given a specific time point, multiple events could be happening at the same time. How do we determine the degree to which each event influenced the ratio? Sometimes, however, an event is so large that it undeniably caused a change in the ratio. Call it a natural experiment. All that said, the purpose of the following in-depth graph is to chronicle the game balance over the years, without pointing too many fingers. 3CAVEATS
4WHY ISN'T [INSERT EVENT HERE] ON THE GRAPH? The graph maker may have missed an important game event (and it should be included). But it's also important to minimize the number of events and game updates on the page, as there's only so much room available. Larger scale events, such as roaming hordes and "big picture" moments in history (e.g., protests) are typically included. While some events clearly had no impact on the ratio, such as The Big Bash 4, they are still listed here. This is mainly included for the reader's interest, since the earlier versions of events tended to have a stronger impact. A few second city events are included for interest, even though their respective populations are not present in Malton's statistics. Some of the simpler or cosmetic game updates are also not mentioned, such as bug fixes, server upgrades, and unofficial changes (example).
5EARLY DAY VOLATILITY The first year or so of Urban Dead's history was marked by rapid game updates, establishing fundamental mechanics that flattened the ratio close to equality. These changes came quickly on the heels of social upheaval, the kind consisting of protests, violent riots, and roaming zombie hordes. It was an energetic, though uncertain time.
8CONCLUSION The ratio stabilized as time went on. By The Long Tail, there were three survivors for every two zombies. (To be precise, it's an average of 1.55 survivors per zombie over the entire game history.) Is this a sign of game imbalance? Of course, "it depends." What things should look like is an opinion (pick one, none, or more):
The opinion of this author: the ratio favours survivors because they have more things to do and are more fun to play. The AP efficiency of actions is secondary to this. The fact that players choose the side they want to play damages the idea that AP efficiency is the cause for the relative overabundance of survivors... with the exception of the few and far between Dual Nature players. Consider game equilibrium. Whenever a survivor is killed, they become zombies until they are revived. The rate at which survivors go through this process depends on how much AP it takes to kill them, to find syringes, find survivors to revive, and then revive them. But the game balance cannot be reduced to the math of AP efficiency. If dead survivors want to be alive, they go to revive points, get revived, and try not to die again. This increases the rate at which survivors are revived, but it is based on player preference rather than the direct cost of AP. To drive the point home, if every player suddenly decides they only want to be zombies, then they purchase brain rot or jump out of buildings. This would greatly slow the rate at which zombies become survivors, increasing the relative abundance of zombies. If we really wanted to know how balanced the game is from an AP efficiency perspective, everyone would need to play as Dual Nature.
OLDER GRAPHS
SEE ALSO
|
